FacebookInstagramYouTube

Welcome to IcebergFinder.com
Your guide to all things bergy

 Chelsey Lawrence

When it comes to viewing icebergs, this is one of the best places in the world. During the spring and summer, these 10,000-year-old glacial giants are visible from many points along the northern and eastern coasts, especially on clear, sunny days. They come in every shape and size, with colours from snow-white to deepest aquamarine. Despite their arrival from the Arctic every spring, and their disappearance only months later, our awe of them remains new, year after year.

Satellite dish

1,337

satellite detections
Camera

3.8K+

uploaded images
Iceberg

1,435m

largest recorded berg

Check out iceberg images from locals and travellers alike as they explore Newfoundland and Labrador. Do you have a recent iceberg photo? Post it on social media using #IcebergsNL and we may use it in our gallery. Or share your iceberg experience by uploading an image to the Iceberg Finder map. Either way, we will all be able to enjoy the wonderful bergs you find on your journey.

About
Iceberg Alley

About 90% of icebergs seen off Newfoundland and Labrador are the broken edges of glaciers from western Greenland, and the rest come from glaciers in Canada's Arctic. Either way, they drift along the same passage of ocean from the northern tip of Labrador, all the way down to the shores of Newfoundland — a passage aptly named 'Iceberg Alley.'

From spring to early summer, Newfoundland and Labrador is one of the top destinations in the world for viewing icebergs. Their sheer size will amaze you, and that's without seeing the ninety-percent still below the surface of the ocean.

Around here, icebergs are so plentiful we actually put them to good use. You can drink them straight, as in Berg water, or in spirits like Iceberg vodka, gin, and rum. And don’t forget the popular Iceberg beer.

And these frosty behemoths are not to be underestimated. In 1912, an iceberg just like the ones we see each year was responsible for sinking RMS Titanic, only 400 miles off our coast.

Visit NewfoundlandLabrador.com to book your own iceberg adventure.

Map of Iceberg Alley

Iceberg
Facts

You might know that only 10% of an iceberg is visible above the waters surface, but did you know they are old? Like, really old? And that as many 40,000 icebergs break off their glaciers every year — although they don't all make it to our shores. We've got more iceberg facts below, courtesy of Dr. Stephen Bruneau. His book, Icebergs of Newfoundland and Labrador, is available from Flanker Press.

A: 90% of icebergs seen off Newfoundland and Labrador come from the glaciers of western Greenland. The rest come from glaciers on islands in Canada’s Arctic area.
A: Icebergs are edges of glaciers that have broken off and slipped into the ocean. Glaciers form on land by snow building up over thousands of years. Each layer of snow compresses those below until, 60 to 70 metres down, glacial ice forms. Glaciers then “flow“ or “creep“ towards the ocean under their own weight, and eventually slip into the ocean. The glaciers of western Greenland flow at speeds of up to seven kilometres a year, among the fastest moving in the world. After slipping into the ocean, the bergs float in frosty Arctic bays melting slowly, if at all, until passing through the Davis Strait and into the Labrador Current which carries them south into Iceberg Alley. Once they head south, they rarely last more than one year.
A: Every year about 40,000 medium- to large-sized icebergs break off, or calve, from Greenland glaciers. Only about 400-800 make it as far south as St. John’s, but these numbers can vary greatly from year to year. The chances of seeing icebergs in a particular area depend on the number of bergs, wind direction, ocean currents and temperatures, and the amount of sea ice, or pack ice. Sea ice protects icebergs from the battering of waves and helps them last longer. Years of little sea ice cover are often years of few icebergs along Newfoundland’s coast. Also, there may be areas where you can’t see any, but 100 kilometres up the coast there might be dozens, so be prepared to travel around. And remember that icebergs are constantly on the move.
A: Would you believe 10,000 years old? It’s true.
A: As glaciers creep over land, meltwater fills the crevasses and later freezes, creating clear, bubble-free ice. This shows up as bluish streaks in icebergs because of the light scattering characteristics of pure ice. Sometimes airborne dust from volcanic eruptions, or the wind, falls on a glacier and becomes trapped inside, forming a noticeably darkened brown or black layer. But because most volcanoes are south of glaciers and winds from the south rarely mix with Arctic air masses, there are very few pollutants in the ice.
A: Iceberg ice is completely safe to consume.
A: No. Icebergs are created from pure, fresh water and snow.
A: Icebergs don’t have a consistent speed. There are many factors that contribute to the speed of an iceberg, like size, shape, ocean currents, waves, and wind. These forces also contribute to the berg’s irregular path, which is equal to two to three times the distance it would travel if it were heading in a straight line - allowing it to drift south for over a week or so. The average drift speed is around 0.7 km/h, although speeds greater than 3.6 km/h have been recorded.
A: Almost 90% of an iceberg is under water, hence the phrase “tip of the iceberg.” Its maximum width under water is 20-30% larger than you can see at the surface. The average depth, or draught of an iceberg, is slightly less than its apparent length above water. Want to delve even deeper? Draw an iceberg and see how it would float using this simulator.
A: Icebergs can vary greatly in size, ranging from very large – greater than 10 million tonnes and hundreds of metres long – to large, medium, and small bergs. The smallest are termed “bergy bits,” which are the size of a small house, and “growlers,” which are the size of a grand piano. These smaller pieces are hazardous to ships because radar may not pick them up as they bob up and down among the waves. The average weight for a Grand Banks-area iceberg is 100,000-200,000 tonnes – about the size of a cubic 15-storey building.
A: In the Northern Hemisphere, the largest iceberg on record was encountered in 1882 near Baffin Island. It was 13 km long, 6 km wide, and was about 20 m above water. It weighed over 9 billion tonnes – enough for everyone in the world to drink a litre of water a day for more than 4 years. Icebergs from Antarctica can be many times larger. In 1987 an iceberg, with an area of 6,350 sq. km, calved from the Ross Ice Shelf. It weighed about 1.4 trillion tonnes and could have provided everyone in the world with 240 tonnes of pure drinking water.
A: Icebergs come in a vast array of shapes due to melting and breaking. Although no two icebergs are exactly the same, there are categories of shapes that are used for observation.
A: Icebergs are often very unstable. The random shape combined with the varying degrees of melting and breakup means they can tip or roll suddenly. Generally, the most stable icebergs are tabular, while domed- and wedge-shaped bergs may roll completely over in seconds without any apparent reason.
A: It’s about 10% as strong as concrete. This may not seem very hard, but it’s a lot harder than ice you make in your freezer. A ship colliding with an iceberg almost certainly means disaster due to the enormous momentum involved and potentially massive contact region. The ice can literally generate hundreds of tonnes of force on a ship’s hull, causing it to buckle, dent, crumple, and even tear apart.
A: Yes, icebergs often “ground“ or reach the seabed and get stuck. This happens when fluctuating tidal currents or strong winds bring icebergs close to shore or onto shallow areas like reefs. At times, icebergs “scour“ the ocean floor, creating irregular troughs that can be several kilometres long and up to half a metre deep. The famous Grand Banks fishing grounds, off Newfoundland’s south coast, have been crisscrossed with these marks for many years.

Discover
How it Works

The icebergs you see on IcebergFinder.com come from two sources: visual sightings from our on-the-ground ambassadors, and satellite detections from C-CORE using data from the European Space Agency (ESA), the Canadian Space Agency (CSA), and the National Aeronautics and Space Administration (NASA). Icebergs are plotted during peak iceberg season, typically from late May to August. The photos you see on our iceberg map come from tourism operators and travellers like you.

The photos on IcebergFinder.com have been uploaded by travellers, local residents, and tourism operators, and give a visual representation of plotted icebergs from prime viewing locations. Photos are of current icebergs and stay on the map for 5 days from the date the images were taken to ensure timely data.

Have you snapped a recent photo of one of these frosty giants? Please upload it to our site, and enter its viewing date and location on our map. Or you can share it on social media using #IcebergsNL, and your photo could wind up on the walls of our online gallery.
The IcebergFinder.com ambassadors are a team of berg-spotting enthusiasts made up of Newfoundland and Labrador Tourism staff and tourism operators. The province's Visitor Information Centres lead the team by making contacts across the province to locate and plot icebergs on IcebergFinder.com. If you'd like to join the ambassador team, please email us.

Icebergs move and melt, so before you travel, be sure to confirm your icebergs location with a nearby Visitor Information Centre or tourism operator.
Thanks to modern technology, some of our icebergs are spotted from space. Analysts look through a combination of radar imagery from ESA and CSA, along with optical images from NASA to identify icebergs close to the coast. All the images are freely available and are collected on a regular schedule over the coastal waters that engulf our over 29,000 kilometres of coastline.

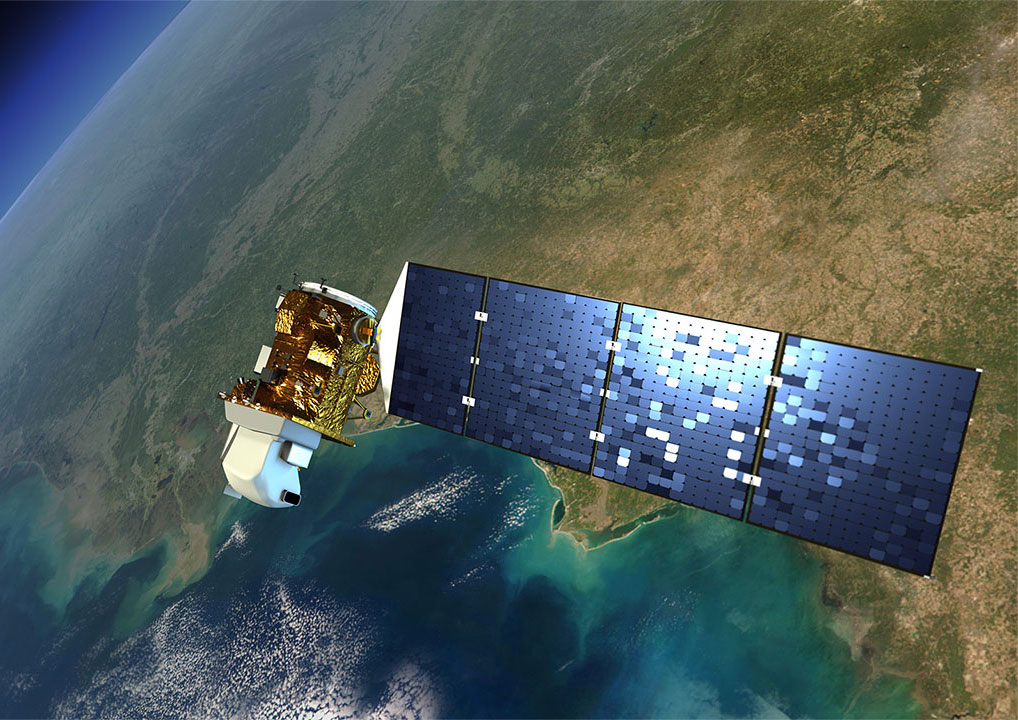
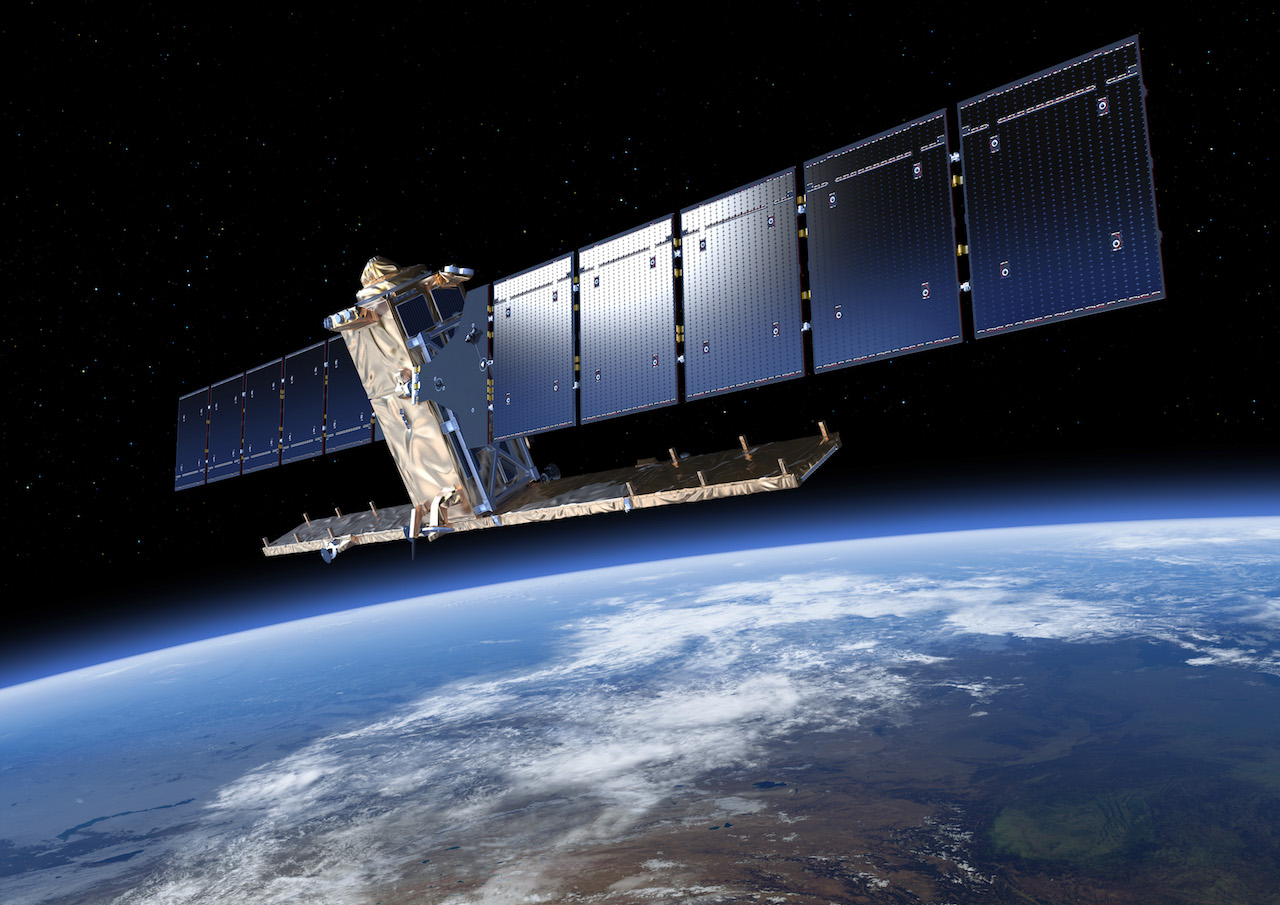
The systems we use to catch a glimpse of icebergs offshore Newfoundland and Labrador are housed on satellites about 800 kilometres above the Earth. Orbiting multiple times a day, the satellites capture images of the Earth’s surface at a given location, at a given instant in time. The radar satellites (Figure 1 and Figure 2) operate at a frequency that sees through darkness, rain, cloud, and even fog – which comes in handy off our coast. Not that we mind fog, around here we tend to think of it as a silver lining. The optical satellite (Figure 3) collects images that are like a photograph that can be easier to interpret. We then analyze these snapshots to find icebergs along the coast.
Satellite
Figure 1. Sentinel-1 radar satellite (image courtesy of ESA)
Satellite 2
Figure 2. Radarsat Constellation Mission (RCM) radar satellite (image courtesy of CSA)
Satellite 3
Figure 3. Landsat 8 optical satellite (image courtesy of NASA)
We’ve all seen radar blips from a ship or an aircraft on TV or in a movie. Satellite radar works in much the same way. It bounces a signal off an object and records the echo, then that data is translated into an image. An object will appear as a bright spot because it reflects more radar energy than its surroundings, but strong echoes can come from anything solid – land, islands, ships, and sea ice, as well as icebergs (see Figure 4).

Sentinel-1 data can be combined (see Figure 5) to make it easier to separate between land (white), sea ice (red), water (black), and icebergs (cyan). The biggest challenge is in separating ships from icebergs.

Optical satellite images look like photographs and the data are much easier to understand. However, cloud cover and fog make it hard to detect icebergs. The patterns of sea ice usually make it possible to separate icebergs and sea ice and there are often lots of icebergs in and around sea ice.

Radar 1
Figure 4. The satellite can see more than just icebergs
Radar 2
Figure 5. Icebergs, sea ice, and land look distinct from each other in satellite radar images.
Radar 3
Figure 6. Landsat 8 image with sea ice and several icebergs indicated
When the radar detects an object, it cant tell an iceberg from a ship or any other solid object. We have to analyze the image for certain characteristics – shape, size, and brightness – to find that out. The radar echo of ships and oil platforms, for example, is so strong that it casts a bright halo around the target, making it look like a star. Iceberg targets look duller, but can still be seen with the radar (see Figure 7). Although, when youre looking at them from the shore, or from a boat, they tend to be anything but dull.

Ships and icebergs
Figure 7. Icebergs appear different than ships and oil platforms
People visit Newfoundland and Labrador from all over the world just to see icebergs. But icebergs are not a tourist attraction for everyone: they can pass close to shipping lanes, fishing grounds, and oil platforms.

Out here on the edge of the continent, to safeguard the shipping lanes between Europe and North America, the International Ice Patrol (IIP), established after the RMS Titanic tragedy, uses satellite and aerial surveillance to spot icebergs and advise vessels of areas to avoid.

Oil companies also use satellite data and aerial surveillance, in addition to their onboard radars, to spot icebergs and determine if they could pose a hazard. In frontier areas, such as Greenland, satellite monitoring is used even more.

Monitored area
Figure 8. Area monitored by satellite for shipping and offshore oil development.

Satellite data provided by:
ESA LogoNASA Logo

Iceberg Alerts

Sign up for Iceberg Alerts and get the latest notifications on icebergs near Newfoundland and Labrador delivered straight to your inbox.